
This publication has carried a number of guest feature commentaries around subjects such as impact investing, and investing with a view to bring about social, environmental and other outcomes that are not always easily measurable in dollars. There remains controversy around the subject - can impact or ESG-based investing match or beat returns from more conventional approaches? This publication does not want to get into the arguments about whether the theories that drive certain ideas are correct in all respects, such as human-caused global warming, but it must acknowledge that many wealthy investors do worry about issues such as global warming, and the need to reduce carbon dioxide emissions and other "Greenhouse gasses".
This article is by Aperio. This is an investment management firm managing approximately $20 Billion in public equity portfolios for ultra-high net-worth investors, foundations, and endowments through financial intermediaries such as independent advisors and family offices. The firm’s major product lines include active tax management and socially responsive indexing/ESG. The firm’s specialty is designing and managing “bespoke” portfolios that can track index benchmarks or deliver targeted risk, factor, geographic, or industry exposures customized to a client’s specific tax situation, values, and/or desired economic exposure.
The article is written by Patrick Geddes; Lisa Goldberg, Robert Tymoczko and Michael Branch.
The editors of this publication want to thank the firm for its article and invite readers to respond. This news service does not necessarily endorse all the views expressed. Email tom.burroughes@wealthbriefing.com
Since we published our last analysis of a US carbon-free tracking portfolio in 2015, the fossil fuel divestment movement has continued to develop across the globe. This version includes updated data and also new analysis of markets outside the United States, including Australia, Canada, and global markets. Within the US, the divestment campaign remains active among campuses, foundations, endowment board rooms, and family offices. More than 100 foundations and family funds have signed a pledge to divest in as part of “Divest-Invest Philanthropy,” while many more foundations are considering their options. These include doing nothing, divesting from just the coal industry, avoiding entire fossil fuel industries, or becoming active shareholders to influence corporate behavior .
When the idea of fossil fuel screening is raised, the first thing an endowment committee, foundation board, or private investor wants to know is whether screening will impose a penalty. While there is no definitive answer, the often-presumed assumption of a return penalty is not consistently borne out by research. In fact, results from a wide range of studies on social and environmental screening do not provide a consensus on whether there has been a return penalty or benefit from carbon screening.
Looking forward, there are compelling scenarios investors can imagine that lead to outperformance of carbon industries and others that lead to underperformance. As an example of the former, large-scale divestments could lower demand for securities in carbon industries, artificially lowering prices. According to an article in the Journal of Financial Economics published in 2009, investors willing to own carbon industry securities could benefit. In the other direction, government-imposed carbon emission controls could lead to stranded assets, permanently eroding profits of companies of carbon-centric companies. The data does not really support either supposition in any clear way, although as humans we naturally cite the version of the future that best serves our goals and prejudices.
Lacking a consistent story about the future return impact of divesting in carbon, we shift the focus onto the impact of carbon screening on portfolio risk. Specifically, we look at the tracking error, or variability of the return difference between an index and a screened portfolio, to measure the impact of exclusion. A lower tracking error means that the screened portfolio replicates the index returns more faithfully . Lower deviation implies that the return of the tracking portfolio is unlikely to vary dramatically from the return to the index. We examine the magnitude of this deviation later in this paper.
Our study focuses on hypothetical equity portfolios obtained by excluding carbon industries from standard market indices in Australia, Canada, and the US, as well as a global index. In each market, we exclude from the universe the Oil, Gas and Consumable Fuels industry from the broadest available index . Then hypothetical portfolios are created using an optimizer to track that respective index as tightly as possible, subject to those industry exclusions, and, of course, the accuracy of the model.
The indices used to create hypothetical carbon-free Tracking Portfolios in each market are shown in Table 1.
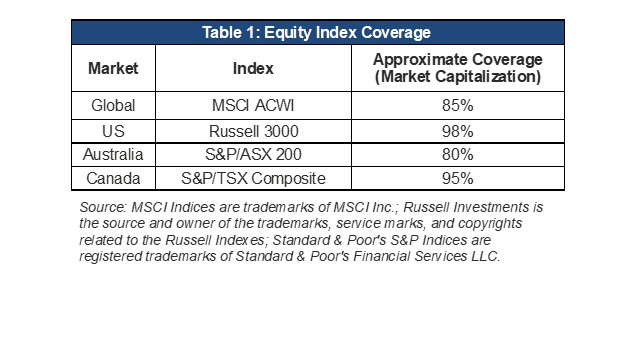
Source: MSCI Indices are trademarks of MSCI Inc.; Russell Investments is the source and owner of the trademarks, service marks, and copyrights related to the Russell Indexes; Standard & Poor's S&P Indices are registered trademarks of Standard & Poor's Financial Services LLC.
Tracking error on hypothetical portfolios
Table 2 shows the tracking errors for the hypothetical carbon-free Tracking Portfolios against their respective indices in the four markets over back-tested periods ranging from 11 to 25 years. The Tracking Portfolios were rebalanced quarterly. In the Australian, US, and global markets, the tracking errors were less than 100 basis points. The larger tracking error of 2.91 per cent in Canada reflects the substantial exposure to Oil, Gas and Consumable Fuels in that country’s stock market. That exposure averaged 20.60 per cent over the 13-year study period. By comparison, the average exposures in the Australian, US, and global markets were 5.10 per cent, 6.80 per cent, and 8.00 per cent over their respective study periods.
Table 2: Market Indices

Source: Aperio Group LLC. Past performance is not a guarantee of future returns. Please refer to important disclosures at the end of this paper.
To put the tracking errors of the carbon-free portfolios into perspective, consider the active risk of 5 per cent taken by the typical institutional investor. That dwarfs the tracking errors of the carbon-free portfolios, even in Canada.
Building the tracking portfolios
It may come as a surprise that the returns to a carbon-free portfolio can closely mimic the returns to a broad market index. The explanation lies in the two-step process used to build a carbon-free Tracking Portfolio. In the initial step, Oil, Gas and Consumable Fuels industry stocks are excluded from the index. In the second step, the remaining stocks are re-weighted so that the portfolio can track the index as closely as possible.
The re-weighting process takes into account the fundamental risk characteristics of the excluded assets, such as their size, valuation ratios, leverage, and liquidity. A quantitative optimization is used to match the risk characteristics of the Tracking Portfolio as closely as possible to the risk characteristics of the index.
Summary statistics for the four market indices and their Tracking Portfolios are shown in Table 3. Note that the annualized returns are higher for the carbon-free Tracking Portfolios than for the indices. The difference is 0.85 per cent in Canada, although it is much smaller in the other markets. Turning from return to risk, the realized total volatility of the Tracking Portfolios is in line with the broad market indices.
Table 3: Summary Statistics*

Source: Aperio Group LLC. The statistics above are shown for illustrative purposes only. They are based entirely on back-tested portfolios and are hypothetical. Each strategy is for the time period indicated, based on data availability. Performance figures shown reflect the reinvestment of dividends and other earnings, are gross of fees, and do not include transaction costs. Past performance is not a guarantee of future returns. Please refer to important disclosures at the end of this paper and refer to Appendix II for hypothetical results including management fees and transaction costs over several historical periods.
The hypothetical returns for Tracking Portfolios should in no way be construed to imply that divestment leads to better performance. They show only that over the time periods analyzed, this version of divestment just happened to play out that way. While doomsayers claiming a return penalty to divestment may resent the fact that there was no such penalty over the period, advocates of divestment may want to avoid promising any grand return benefit in the future based on the stranded-asset hypothesis that supposes carbon assets to be overvalued. An inability to predict returns leaves investors with managing risk, something we can all control to a much greater extent.
Active sector weights
As funds normally allocated to carbon industries need to be re-allocated in the carbon-free Tracking Portfolios, it is inevitable that some sectors become overweighted. Table 4 shows the active weights of the carbon-free Tracking Portfolios relative to their indices. On average over the study periods, the carbon-free Tracking Portfolios were overweight in the Utility sector by 1.26 per cent in Australia, 3.67 per cent in Canada, 3.08 per cent in the US, and 2.75 per cent in the global market. In other words, the investment shifted from carbon-heavy energy producers to energy consumers. For some investors concerned with climate change, this transfer may not be acceptable from a values perspective. The effect can be mitigated or eliminated by constraining utility stocks too, but the likely result would be an increase in tracking error.

Long-run performance
Here we revisit the issue of the return benefit or penalty that we raised in the introduction. Specifically, we ask: How different are the carbon-free Tracking Portfolios from their indices over 10-year horizons? Figure 1 shows 10-year return differences between the US carbon-free Tracking Portfolio and its benchmark. The blue bars above the 0.00 per cent line indicate that the Tracking Portfolio earned a higher average annual return over the trailing 10-year period, while those below the line indicate the periods for which the portfolio performed worse than the benchmark. The return differences were positive until late 2006 and have been mostly negative since then. Note, however, that the magnitudes of the differences are small throughout the study period.
In the Australian, Canadian, and global equity markets, the return differences were uniformly positive over every 10-year horizon in the study periods. The return differences were less than 0.50 per cent in the Australian, US, and global markets, which have relatively low exposure to carbon securities. Even in Canada, which has high carbon exposure, the return differences were close to 1.00 per cent at their highest and often smaller. Average return differences are shown in Table 5.

Summary
In deciding whether to divest assets in carbon industries, investors face compelling arguments on both sides. From the advocates of divestment, investors hear about the serious environmental damage already incurred and the benefit from taking a public stance on a critical ethical issue.
Others, who are concerned about stranded assets, may divest for strictly economic reasons, but either motivation introduces the same tracking error. From the skeptics, investors may hear that screening will adversely affect risk and return and that the goal of any endowment should be to focus exclusively on financial goals. The data do not support the skeptics’ view that screening negatively affects an index-tracking portfolio’s return. In fact, they show that the impact on risk may be far less significant than presumed.
Carbon-free investments with low tracking error could have been implemented by shifting the allocation from the Oil, Gas and Consumable Fuels industry to Utilities and Materials. It is beyond the scope of this paper to judge whether investors should implement or avoid screening, but anyone facing that decision should be aware that historically it has been possible to closely track broadly diversified indices with carbon-free portfolios.
Footnotes
1, Divest-Invest Philanthropy is an initiative to help philanthropic organizations divest assets in fossil fuels and invest in climate solutions. More information can be found at: http://divestinvest.org/philanthropy/.
2, The Asset Management Working Group of the United Nations Environment Programme Finance Initiative and Mercer, “Demystifying Responsible Investment Performance,” 2007.
3, For a tobacco-based example, see Harrison Hong and Marcin Kacperczyk. “The price of sin: The effects of social norms on markets.” Journal of Financial Economics, 93:15–36, 2009.
4, For more information on stranded assets, see, for example, “Unburnable Carbon 2013: Wasted capital and stranded assets,” a collaboration between Carbon Tracker and the Grantham Research Institute, LSE, at: http://carbontracker.live.kiln.it/Unburnable-Carbon-2-Web-Version.pdf.
5, A definition of tracking error is given in Appendix I.
6, In practice, a portfolio with a tracking error below 100 basis points is often defined as “indexed.”
7, For the US simulations, the following Barra industry definitions were used: Energy Reserves and Oil Refining.
8, There are numerous ways to divest from fossil fuels. An investor can focus on excluding either 1) the companies or industries that contribute to the supply of fossil fuels, such as oil and coal companies, or 2) industries that are significant contributors to the demand for fossil fuels, such as coal-powered utilities. Organizations like Carbon Tracker have analyzed fossil fuel use and created a list of the 200 worst offenders. In our experience, the decision on what to divest reflects an organization’s or individual’s views. Aperio Group has implemented a wide range of divestment screens but for the purposes of this paper, we kept it simple and most easily replicable by using an exclusion that contributes most heavily to the supply. This is by no means a recommendation that that is the right screen for everyone , but rather a reasonably representative example.
9, In each market, we began at the earliest possible start date given data available for the model
10, MSCI ACWI Index is rebalanced and the large- and mid-capitalization cutoff points are recalculated during the May and November semi-annual index reviews; the Russell 3000 Index is rebalanced on an annual basis—in 2014, the newly reconstituted index took effect after market close on Friday, June 27; the S&P/TSX 200 Index constituents are rebalanced quarterly with changes taking effect on the third Friday of March, June, September, and December; the S&P/TSX Composite Index is rebalanced quarterly.
11, Based on a survey by Callan Associates, Inc., Mercer Investment Consulting, and Watson Wyatt Worldwide. For details see GMO, 2007, White Paper, “What Should You Pay For Alpha?”
12, Asset characteristics are based on the Barra US Equity Models and the Barra Global Equity Model multi-factor models.
13. For the portfolios constructed in this article, the optimization relies on Barra Aegis multi-factor models. The process of using an optimizer in combination with a multi-factor model to manage risk in screened portfolios has been validated in a number of articles in academic finance journals that explain this math in greater detail, e.g.:
Patrick Geddes. “Measuring the Risk Impact of Social Screening.” Journal of Investment Consulting, 13: 45–53, 2012.
William W. Jennings, and Gregory W. Martin. “Socially Enhanced Indexing: Applying Enhanced Indexing Techniques to Socially Responsible Investment.” Journal of Investing, 16: 18–31, 2007.
Lloyd Kurtz and Dan diBartolomeo. “The Long-Term Performance of a Social Investment Universe.” Journal of Investing, 20: 95–102, 2011.
Moshe Milevsky, Andrew Aziz, Al Goss, Jane Thompson, and David Wheeler. “Cleaning a Passive Index.” Journal of Portfolio Management, 32: 110–118, 2006.
14, These are geometric returns annualized from monthly data.
15, If the distribution were normal, the annual return of a portfolio with a tracking error of 0.93% would, on average, be within 0.93% of the benchmark return in roughly 2 out of 3 years, and within 1.86% of the benchmark return in roughly 19 out of 20 years.
Definitions
Alpha: A measure of a manager’s contribution to performance due to security selection or market timing relative to the index.
Beta: A measure of a portfolio’s sensitivity to changes in a benchmark.
Estimated tracking error: A measure of how closely a portfolio is expected to track its benchmark. More formally, it is defined as the standard deviation of the expected difference between the annual returns of a portfolio and its target benchmark.
In other words, the annual return of a portfolio with a tracking error of 0.93 per cent is expected to be within 0.93 per cent of the benchmark return much of the time and within 1.86 per cent of the benchmark return most of the time.
Sharpe Ratio: The average portfolio return in excess of the risk-free rate divided by the volatility of portfolio excess return. The Sharpe ratio is a type of information ratio in which the benchmark is the risk-free rate.
Standard Deviation: A statistical measure that is used to quantify the level of dispersion in a variable data set, such as portfolio return.
Tracking Error: A measure of how closely a portfolio tracks its benchmark. In technical language, tracking error is the standard deviation of the return difference between a portfolio and a benchmark.
Aperio Group would like to acknowledge the help of the following people and their firms for their insights and expertise in the carbon issue: Andrew Behar of As You Sow; Dan Apfel of The Responsible Endowment Coalition; Thomas Van Dyck; CIMA from SRI Wealth Management Group of RBC Wealth Management; Craig Muska of Threshold Group; Jeffrey R. Croteau, CFA, of Prime, Buchholz & Associates, Inc.; Jamie Henn of 350.org; Rodney Sullivan from the CFA Institute; and Robert Anderson from the U.C. Berkeley Center for Risk Management Research.